The Truth About COVID-19 Antibody Test
- You Tao, PhD

- Apr 13, 2020
- 11 min read
Updated: Apr 15, 2020
“Death’s got an Invisibility Cloak?” Harry interrupted again. “So he can sneak up on people,” said Ron. “Sometimes he gets bored of running at them, flapping his arms and shrieking.”
J. K. Rowling, Harry Potter

With no vaccination in sight, for any country, the only way to defeat COVID-19 is through proactive contact tracing and quarantining, which needs to be supported by testing.
Downing Street is fully aware of this. No 10 announced it would increase testing capacity to 100,000 per day by the end of April [1]. Yet, in a dramatic turn, the UK cancelled its order of 17.5m test kits from China on 6 April [2].
Perhaps few asks it better than Prof David Sinclair at Harvard Medical School’s Department of Genetics, who shared his own experience with SARS-CoV-2 antibody test on LinkedIn on Thursday 9 April 2020 [3].
“Took a test today. Negative. It was super easy. Can someone explain why these 15 minute #coronavirus #antibody tests aren’t approved for home use? My kids could have run this, with a finger prick and a drop of blood. Is it a current lack of tests, the ~90% accuracy, or the government doesn’t trust us with the information? 🤔 If the latter is true, isn’t testing our best weapon? Aren’t all tests flawed? Is 90% better or worse than zero knowledge? Can we take more tests to improve accuracy? If tests for antibodies aren’t accurate enough, why are these type of tests FDA approved for doctors‘ use? And do we or don’t we have a right to find out what’s going on in our own bodies? Just want to understand. Thanks.” [3]
After reading this post, you will understand
How do the SARS-CoV-2 antibody tests work?
95% is pretty high, so if you take a test and the result is positive, does it mean there is 95% chance that you have contracted with the virus?
If interpreting the test result depends on COVID-19 prevalence in the UK, how much is it?
Will meeting the UK government’s technical requirements for SARS-CoV-2 antibody test guarantee accurate results?
How good are the existing available tests?
Can antibody test kits be used to protect the vulnerable in care homes?
Care home workers are in close contact with a high-risk population that is vulnerable to COVID-19. In France, Italy and Spain, 45%~57% of total COVID-19 deaths occurred in care homes. However, care home workers are not routinely tested in the UK [4]. People are urgently asking when carers will be tested to save lives.
Combination of two or more SARS-CoV-2 antibody tests for care home workers might help better identify carriers and protect the vulnerable. To select a sensible combination, perhaps Prof John Bell’s validation data commissioned by Department of Health and Social Care may help. This may save many lives!
How do SARS-CoV-2 antibody tests work?
Immunoglobulin M (IgM) antibodies are produced early in a viral infection, while immunoglobulin G (IgG) may appear in blood circulation a few days later. IgG and IgM antibodies may be detectable for a while after COVID-19 infection is over, before they eventually disappear. The strength of antibody response depends on age, nutritional status, severity of disease, and certain medications or infections like HIV that suppress the immune system [5,6,7].
A SARS-CoV-2 antibody test detects traces of antibody (IgG/IgM/both) specific to SARS-CoV-2 virus in blood.
95% is pretty high, so if you take a test and the result is positive, does it mean there is 95% chance that you have contracted with the virus?
Suppose the manufacturer tells you 95% of the people with SARS-CoV-2 antibody would test positive with the test kit. Does this mean there is a 95% chance of having SARS-CoV-2 antibody in your blood given a positive test result?
The answer is no, and probably a lot less likely.
The real likelihood for SARS-CoV-2 antibody to be present in your blood is the fraction of clinically confirmed COVID-19 cases correctly identified by the test from all cases tested positive, including those clinically confirmed positive cases that were correctly tested positive, as well as those clinically confirmed negative cases that were incorrectly tested positive. This can be written as

PPV: Positive predictive value. The likelihood of the presence of SARS-CoV-2 antibody in your blood.
P: Total positives. The number of clinically confirmed positive cases, or the size of infected population.
TPR: True positive rate (aka sensitivity). The fraction of cases that tested positive from all clinically confirmed COVID-19 cases, which is 95% in our example.
N: Total negatives. The number of clinically confirmed negative cases, or the size of uninfected population.
TNR: True negative rate (aka specificity). The fraction of cases that tested negative from all clinically confirmed COVID-19 negative cases. Manufacturer should provide this value.
Let’s use an example (let TPR=TNR=95%) to see what this means. For a sample size of 10,000. If true prevalence rate of the disease is 5%, then 500 people are infected, and 9,500 people are not.
On one hand, 95% of 500 people with antibody (475 people) would be correctly identified by the test.
On the other hand, at 95% TNR, 5% of the uninfected 9500 people (475 people) would also get positive test results.
Hence, out of 950 people who tested positive, only half are real cases. The same as flipping a coin!
If this test yields a positive test result in an area of 90% infection, this would strongly indicate the presence of SARS-CoV-2 antibody in blood. In contrast, a positive test result in an area of 1% infection is unlikely to mean anything. It all depends on where the test is taken! Strange but true.
Now you see the prevalence of COVID-19 in the UK affects how test result should be interpreted, then how much is it?
From the last post “When Is This Hell Over” (https://letsgobeyond.co.uk/post/when-is-this-hell-over), an intuitive model was constructed to make UK predictions. Naturally, you must wonder if the model was accurate and how much prevalence it would predict.
Did the model predict the deaths between 4 April and 14 April?
The model was calibrated to recapitulate cumulative NHS hospital deaths before lockdown on 23 March. Let’s compare prediction with data.
Since the post was published on 3 April, it has been a terrifying 11 days as the UK witnesses over 8,000 deaths from 4 April through to 14 April, bringing the total NHS hospital death toll to 11,329 [8]. Before going into the details, it is worth pointing out these figures do not include deaths in community and in care homes, which make the total figure even higher.
With the same model simulation, I have updated the published plots with the deaths data from 4 April to 14 April (Figure 1 and Figure 2). The reported numbers of daily deaths are noisy (Figure 1). However, most data from 4 April onwards are within 90% confidence interval of model simulation (Figure 1). The reported cumulative death curve is smoother. All numbers from 4 April to 14 April are in line with 90% confidence interval of model simulation (Figure 2).
Figure 1. Predicted daily deaths in the UK in natural (left) and log (right) scales. Pink dots connected by lines: Data between 6 March 2020 ~ 14 April 2020 [8]. Pink shaded area: 90% confidence interval of model predictions. Black curve: Expected results by the model.
Figure 2. Predicted cumulative deaths in the UK in natural (left) and log (right) scales. Pink dots connected by lines: Data between 6 March 2020 ~ 14 April 2020 [8]. Pink shaded area: 90% confidence interval of model predictions. Black curve: Expected results by the model.
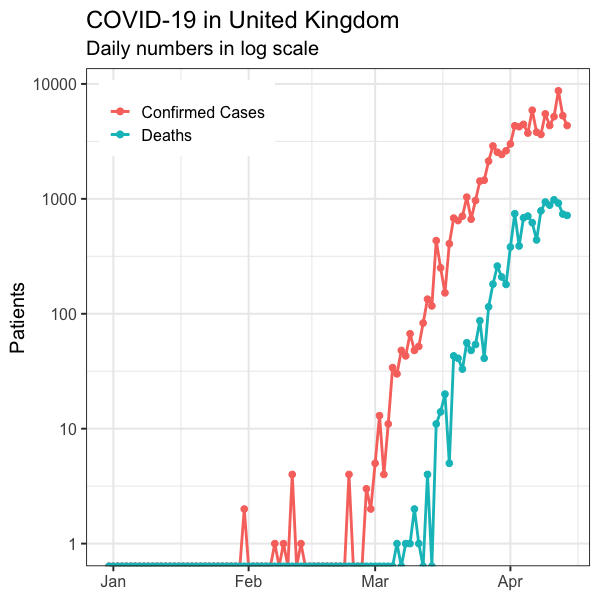
The model predicts daily deaths should plateau around 11 April. Any evidence to verify this? Figure 3 shows the reported daily confirmed cases reached plateau in early April and daily deaths seem to have plateaued in the week starting 6 April.
Figure 3. Daily confirmed COVID-19 cases and deaths in the UK up until 11 April 2020 [7]. Pink: Confirmed cases. Teal: Deaths.
In short, model predictions for deaths are consistent until 14 April 2020.
What is the COVID-19 prevalence in the UK?
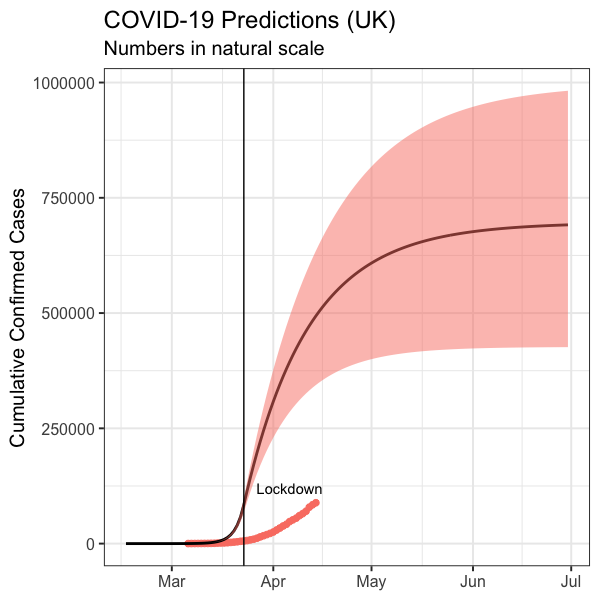
Figure 4 plots model predictions of how many may be infected by COVID-19 in the UK. This figure also previously appeared in the last post and I have only updated the data but not the simulation here (Figure 4).
Figure 4. The predicted cumulative carriers plotted with the UK reported cumulative confirmed cases before 14 April 2020.
According to the model, by 11 April (when the blog post was originally published), 461,000 people are expected to have been infected, with 90% confidence interval ranges from 326,000 to 586,000 people. For the 66.65m population in the UK estimated by world bank, this means the prevalence forecast is 0.69% with 90% CI (0.49% ~ 0.88%).
UK pharmaceutical company AstraZeneca announced it expected tests satisfying government requirements should be delivered in May [9]. On 31 May, prevalence is expected to be 1.01% with 90% CI (0.63%, 1.42%).
Will meeting the UK government’s technical requirements for SARS-CoV-2 antibody test guarantee accurate results?
Medicines & Healthcare products Regulatory Agency (MHRA) announced specification criteria for serology/antibody point of care test (TPR=98%, TNR=98%) and self-test (TPR=95%, TNR=98%) on 8 April [10].
Plugging in the prevalence of 0.69% and 1.01%, positive predictive value (PPV, the likelihood of the presence of SARS-CoV-2 antibody given a positive test result) can be worked out for tests with different true positive rate (TPR, aka sensitivity) and true negative rate (TNR, aka specificity) values (Figure 5).
Figure 5. Forecast PPV vs TPR in the UK, at prevalence predicted by You Tao’s pandemic model. Solid lines: Expected UK prevalence on 11 April (0.0069). Dashed lines: Expected UK prevalence on 31 May (0.0101). Red: TNR=0.9. Green: TNR=0.95. Blue: TNR=0.98 (UK requirement). The UK TPR requirements are marked vertically.
Interestingly, the curves are nearly horizontal, indicating PPV is mostly insensitive to TPR over 0.85 (Figure 5).
Strikingly, none of the curves has a positive predictive value higher than 0.5. In other words, a positive test result does not indicate as well as flipping a coin!
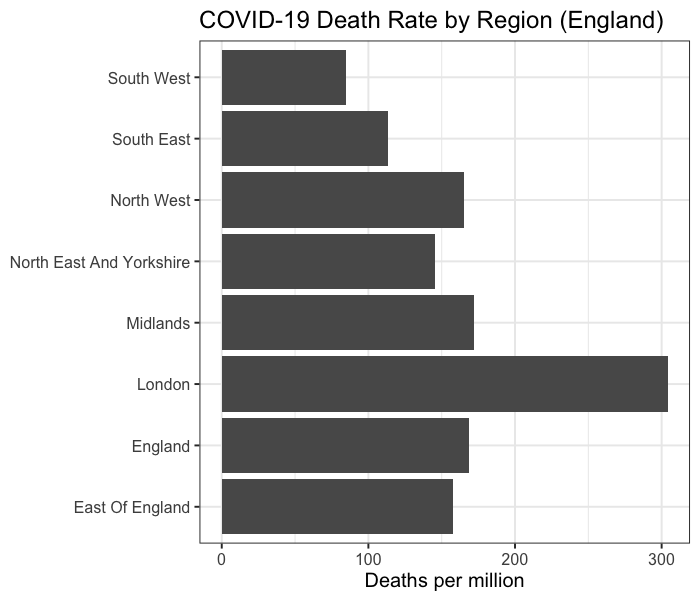
However, the disease distribution in the UK is not uniform. As until 11 April 2020, England averages 169 cumulative deaths per million people, while London averages 304 (Figure 6).
Figure 6. Deaths per million in different regions of England. This is calculated by total deaths until 5pm 11 April 2020 [11] divided by regional population [12].
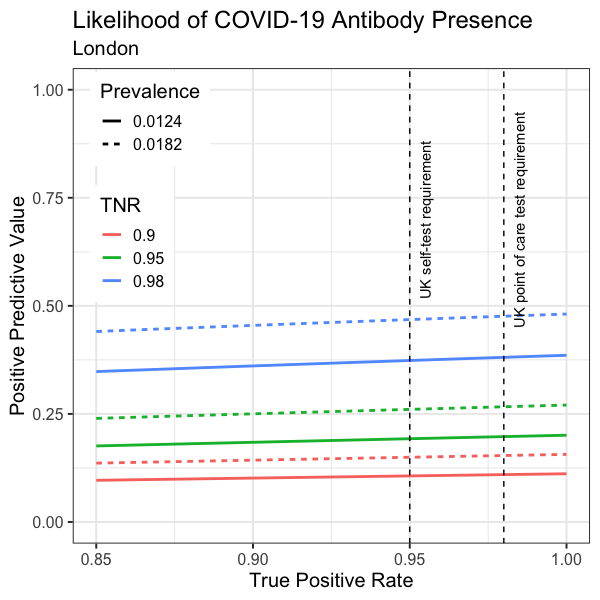
Assuming prevalence is directly proportional to cumulative deaths per million, PPV is calculated and visualised for London (Figure 7). As expected, PPV is higher in London. However, PPV forecast is still less than 0.5 under any of the circumstances (Figure 7).
Figure 7. Forecast PPV vs TPR in London, at prevalence predicted by You Tao’s pandemic model and scaled for London. Solid lines: Expected London prevalence on 11 April (0.0124). Dashed lines: Expected London prevalence on 31 May (0.0182). Red: TNR=0.9. Green: TNR=0.95. Blue: TNR=0.98 (UK requirement). The UK TPR requirements are marked vertically.
In fact, when prevalence reaches 2%, a 98% specific test (TNR=98%) with a perfect sensitivity (TPR=100%) would give a PPV of 0.5. Unless COVID-19 prevalence is higher than 2% (which is unlikely), the 98% specificity requirement would not give a PPV over 0.5.
How good are the existing available tests?
Many manufacturers claim ~90% TPR (sensitivity) and ~95% TNR (specificity). These are supported by the data they submitted to regulatory authorities as part of the approval process. As long as the product has a CE marking, it should specify these parameters.
Prof John Bell at Oxford led an independent validation of the available antibody tests. Unfortunately, it was concluded no test kit was found to satisfy the requirements [13]. Allegedly, the study found many false negatives and some false positives [13]. However, the data were not released, and it was not possible to evaluate the extent and severity of the problem. It would be very helpful to open up the data for clarity.
Does this sound like a hopeless case? Don’t give up just yet.
Can antibody test kits be used to protect the vulnerable in care homes?
Two different antibody tests may be combined to increase specificity to better identify carriers:
TNR(combined test) = TNR(test 1) + TNR(test 2) - TNR(test1) x TNR(test 2)
For two different kits with 90% specificity and 95% specificity, a combined test would offer 99.5% specificity. This reduces false negatives and ensures care home workers are fit for work, especially as the virus may spread by asymptomatic carriers.
The use of a combined test may provide a sensible preventive measure. In China, some hospitals require antibody test done (though may be a single test) on site before inpatient medical appointment. It makes perfect sense to deploy the fast and cheap blood tests for this purpose.
This sounds amazing but we need to check the implicit assumption. For the equation to work, the two tests have to be independent, meaning the results to the same samples in a clinical trial should not be correlated to each other. A trial of this sort may involve blood samples from 500 or more cases, including clinically confirmed COVID-19 positive cases, clinically confirmed COVID-19 negative cases, and cases carrying other types of virus. Prof John Bell’s benchmarking dataset may be used to identify two such test kits that have reasonable specificity and critically responded independently to the same blood samples used for benchmarking.
Conclusions
Interpreting antibody test results requires the prevalence rate in your area. The government needs to provide guidance for this
No antibody test would give you a definitive answer with 95% certainty right now, due to low prevalence rate
Meeting the UK government’s technical requirements for SARS-CoV-2 antibody test does not lead to 95% certainty
SARS-CoV-2 antibody test may still be useful in a preventive sense
Combining antibody tests may improve specificity and reduce false negatives. This can help better protect the vulnerable in care homes
Selection of the right combination requires re-evaluating Prof John Bell’s existing data
How many vulnerable elderlies would die before a mass testing programme is finally delivered? Given the urgency, while developing an accurate test, perhaps we should also look at how best to combine existing test kits to improve specificity. If John Bell’s benchmarking dataset is made available to the public, a highly specific combined antibody test may be identified. If we are lucky enough to achieve this, such rapid diagnostics would help care homes to reduce infection, which will also take some pressure off the NHS. Hopefully, this may allow the UK to come out of the lockdown sooner, which is urgently needed to fix the economy worst hit after the second world war.
Acknowledgement
After the initial publication of the post on 12 April 2014, Dr Zhou Cong (Lead statistician, CRUK Manchester Institute Cancer Biomarker Centre) who specialises in cancer diagnosis and treatment, proofread the article and made some useful suggestions to improve the article. The author would like to grateful acknowledge Dr Zhou's kindness. https://www.research.manchester.ac.uk/portal/cong.zhou.html
The author would like to thank Dr Ray Perkins who is among the first readers of the original post for discussion and encouragement. Dr Perkins is an expert in proteomics based in Kentucky. https://www.linkedin.com/in/ray-perkins-b07a2211/
Reference
[1] Coronavirus (COVID-19) Scaling Up Our Testing Programmes. Department of Health and Social Care Policy Paper. Published on 04 April 2020 https://assets.publishing.service.gov.uk/government/uploads/system/uploads/attachment_data/file/878121/coronavirus-covid-19-testing-strategy.pdf
[2] Camilla Hodgson and George Parker (London). UK Government Admits SARS-CoV-2 Antibody Tests Don’t Work. Financial Times. 6 April 2020. https://www.ft.com/content/f28e26a0-bf64-4fac-acfb-b3a618ca659d
[3] Prof David Sinclair's post and discussions on LinkedIn. https://www.linkedin.com/posts/sinclairda_coronavirus-antibody-antibody-activity-6653879475392049152-QFKn
[4] Mortality associated with COVID-19 outbreaks in care homes: early international evidence. 12 April 2020.
[5] Zhao J, Yuan Q, Wang H, Liu W, Liao X, Su Y, et al. Antibody responses to SARS-CoV-2 in patients of novel coronavirus disease 2019. medxriv. 2020; https://www.medrxiv.org/content/10.1101/2020.03.02.20030189v1.full.pdf
[6] Okba N.M.A, Muller M.A., Li W, Wang C, et al. SARS-COV-2 specific antibody responses in COVID-19 patients. medxriv. 2020 https://www.medrxiv.org/content/10.1101/2020.03.18.20038059v1
[7] Gorse GJ, Donovan MM, Patel GB. Antibodies to coronaviruses are higher in older compared with younger adults and binding antibodies are more sensitive than neutralizing antibodies identifying coronavirus-associated illnesses. Journal of medical virology. https://doi.org/10.1002/jmv.25715
[8] All data used in this article come from EU Open Data Portal (https://data.europa.eu/euodp/en/home): https://www.ecdc.europa.eu/sites/default/files/documents/COVID-19-geographic-disbtribution-worldwide.xlsx
[9] Sarah Boseley, Ian Sample, Rowena Mason and Heather Stewart. UK Covid-19 Antibody Tests Not Ready Until May at Earliest. The Guardian. 8 April 2020. https://www.theguardian.com/society/2020/apr/08/uk-covid-19-antibody-tests-not-ready-until-may-at-earliest
[10] Specification Criteria for Serology Point of Care Tests and Self-Tests. Medicines & Healthcare products Regulatory Agency. 8 April 2020. https://assets.publishing.service.gov.uk/government/uploads/system/uploads/attachment_data/file/878659/Specifications_for_COVID-19_tests_and_testing_kits.pdf
[11] COVID-19 Daily Deaths https://www.england.nhs.uk/statistics/statistical-work-areas/covid-19-daily-deaths/
[12] Mid Year Population Estimate Of England In 2018 by Region https://www.statista.com/statistics/294681/population-england-united-kingdom-uk-regional/
[13] Trouble in Testing Land https://www.research.ox.ac.uk/Article/2020-04-05-trouble-in-testing-land
Comments by Readers
"I was shocked that even the tests with high levels of sensitivity and specificity don't perform well when there is a low prevalence of seropositivity in the population." - Sven Mostboeck, PhD https://www.linkedin.com/in/sven-mostboeck/


Comments