When Is This Hell Over?
- You Tao, PhD

- Apr 3, 2020
- 9 min read
Updated: Apr 10, 2020
“I have no idea what's awaiting me, or what will happen when this all ends. For the moment I know this: there are sick people and they need curing.”
Albert Camus, The Plague


COVID-19 has come to your doorstep. It has brutally taken away mothers, fathers, sons and daughters, while mourners cannot grieve properly.
On 23 March, UK prime minister Boris Johnson announced a nationwide lockdown that put unprecedented restrictions on where and how people may travel and gather.
The NHS tells people with high temperature and cough symptoms to self-isolate for 7 days so that they may recover at home. By now, we have stayed at home for 7 days, except key workers. Suppose anyone with persistent symptoms have all been isolated and treated in the hospital (hence not infectious anymore), it should be over already.
In stark contrast, on 2 April, a record 743 people have been confirmed to have died of coronavirus in NHS (i.e. UK’s state funded health services) hospitals on the day before, bringing the UK death toll to 2,532 [1].
The question is, did social distancing work? And above all, when will lives return to normal?
After reading this post, you will understand
Why did it take China 2 months to recover, not 7 days?
Is the UK in it for the long haul and why?
What does COVID-19 testing mean to the UK?
The situation is grave but there is hope. Giving the newly found reasoning and understanding, you will have a clearer assessment of how life may in the near future. Hopefully, you will think about what you can do and you will feel more in control.
Which countries have taken control over COVID-19?
The number of confirmed cases is often used in the media to describe the prevalence of COVID-19. In really, it is limited by testing capacity and reporting, and it might not reflect the true extent of the spread of the disease.
On the other hand, the number of deaths might provide a more accurate picture. I plotted the cumulative death tolls from some industrialised nations since 31 Dec 2019 [1]. For all curves to be easier to see, the cumulative number of confirmed cases is plotted in logarithmic scale. Looking at the graph, it is clear that China has won its battle for now, while the curve is tapering off for Japan and Korea Republic.

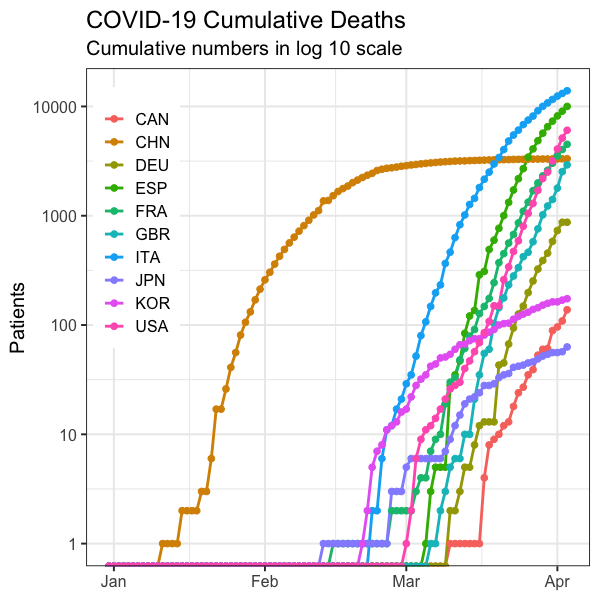
Figure 1. Cumulative COVID-19 deaths of several industrial nations between 31 December 2019 and 3 April 2020 [1].
To quantitatively understand how quickly social distancing takes effect so as to predict when the UK may turn the tide and then return to normal, we need to first look at China.
How quickly did social distancing help China win the battle against COVID-19?
On 23 January, Wuhan (the epicentre of COVID-19), went into lock down, after allegedly 5 million residents left for Chinese New Year. Overnight, the city of 11M became a ghost town. It then took nearly 8 weeks for China’s daily confirmed new cases and deaths to come back to levels comparable to where it was before the lockdown (Figure 2 left).

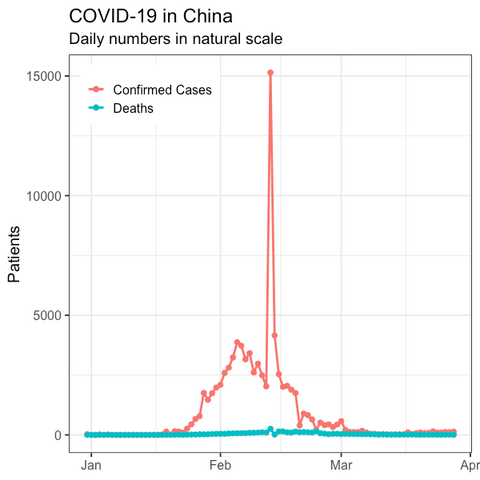


Figure 2. Daily confirmed cases and deaths in China (31 Dec 2019 ~ 28 Mar 2020) plotted in natural (left) and log (right) scales.
Note there is a huge spike in the number of daily confirmed new cases on 13 and 14 February. This is due to the change in way of counting after the sack of a government official in Hubei province (where Wuhan is). Considering this, the daily confirmed new cases prior to that date might significantly underestimate the real figure.
If you look at the same data in log scale (Figure 2 right), you would see despite the strict lockdown, daily death toll rose sharply from 10 to 100 patients a day within 3 weeks.
The important question to answer is what underpins the delay between the start of lockdown and the daily deaths peak?
This is longer than the 7 days by intuition. Why is this?
To explain these, there is an excellent Epidemic Calculator (http://gabgoh.github.io/COVID/index.html) for anyone trained in epidemiology [2]. It uses a widely accepted infectious disease model that considers different populations with a few parameters that carry clear meanings [3]. The trouble is, at least 11 accessible studies quantified parameters in this model but reported different estimates [2].
I am not a trained epidemiologist. If you are like me, you would probably find the following simple model easier to understand. I use it to describe how the daily confirmed new cases and daily deaths change over time and it does a good job. We will use it for our discussions here.


Figure 3. Diagram of a model to describe COVID-19 pandemic in China
This model considers the following populations with a few parameters:
Ni: The number of infected patients that are not quarantined, including both asymptomatic and symptomatic carriers
Nq1: Quarantined patients (compartment 1): Further spread of the disease is prevented
Nq2: Quarantined patients (compartment 2) before either recovery or death
Nr: Patient who recovered after treatment
Nf: Patient who died after treatment (f stands for fatality)
g: Exponential growth rate (per day)
k1, k2: Transition rates (per day)
d: The fraction of patients from Nq2 population who died
Essentially, this model tries to represent the time delays between subsequent events: Patients are infected before they are quarantined and they hopefully recover or unfortunately die. To capture time delay between confirmed cases and deaths, the confirmed cases is further divided into Nq1 and Nq2 compartments and a patient moves from Nq1 to Nq2 with time. Nf represents the number of deaths.
For simplicity, the model assumes infection immediately stops upon lockdown (i.e. g=0 from 23 January onwards in China).
Making sense of China’s picture
The model is then calibrated using China’s cumulative confirmed cases and cumulative death reported between 31 Dec 2019 and 28 Mar 2020. Ninety percent confidence intervals of model prediction covers most of the data (Figure 4 and Figure 5).


Figure 4. Model prediction for China’s cumulative confirmed cases between 31 Dec 2019 and 28 Mar 2020, plotted in natural (left) and log (right) scales. Shaded area is 90% confidence interval of model predictions. Data are plotted in connected dots.


Figure 5. Model prediction for China’s cumulative deaths between 31 Dec 2019 and 28 Mar 2020, plotted in natural (left) and log (right) scales. Shaded area is 90% confidence interval of model predictions. Data are plotted in connected dots.
Considering the huge increase in the number of daily confirmed new cases on 13 and 14 February making all data before that unreliable, the model does a reasonable job to retell what might have happened in China.
Interestingly, the model also expects the number of confirmed cases prior to 14 February to be higher than what was reported (Figure 4).
Seeing the invisible: Why did it take China 2 months?
When we plot how all components of the model set in motion, the dynamics starts to make sense. The model predicts the number of infected patients who are not quarantined (Ni) builds up prior to the lockdown. After 23 January, a tide of these patients become confirmed cases and are quarantined.


Figure 6.Model prediction of how different populations changed over time in China, plotted in natural (left) and log (right) scales.
To make the death toll easier to read, I also plotted the predictions in log scale. You may see predicted daily death toll peaks approximately 2 weeks after lockdown and it trails the peak of predicted daily confirmed new cases by approximately 1 week.
The sheer number of infected people who were not quarantined prior to lockdown was so huge that it took China about 2 months for the number of patients under quarantine to go back down to previous levels.
The point is the sooner lockdown is implemented, the quicker the recovery would be.
Is the UK in it for the long haul?
Wuhan lockdown was implemented when the cumulative death toll was at 17 [1], a number that is much lower than the death toll in the UK when lockdown was announced on 23 March, a staggering 335! [1]
What would happen if we use this model trained with China’s data to predict how long it takes for UK return to normal, and how many may die?
This model is built to represent a scenario where the pandemic comes from a single patient. To apply it to the UK where multiple carriers from Italy and France started community-based transmissions to let COVID-19 built a strong foothold, the starting point was shifted to 15 February, so as to mimic the COVID-19 cumulative deaths in UK before lockdown on 23 March (see Figure 7).


Figure 7. Predicted cumulative deaths in the UK in natural (left) and log (right) scales.
As you may see, the predicted cumulative deaths after UK lockdown is in good agreement with UK data (until 3 April 2020), as the data are within 90% confidence interval, although may be somewhat lower than the expected values (Figure 7).
The daily death toll may appear more random but is not far from the 90% confidence interval of the model predictions (Figure 8). The peak in daily deaths is expected in the week starting 6 April by the model, which also predicts we may see daily deaths to (agonisingly) slowly come down the week after.


Figure 8. Predicted daily deaths in the UK in natural (left) and log (right) scales.
This might be later than China because the UK went into lockdown later. Given the difference in countries, I do not think it is fair to simply shift blame to the UK government for this. In early days, a pandemic is sporadic and it takes time for the evidence to emerge to make decisions about something as drastic as a nation-wide lockdown.
The model also predicts daily deaths might come down to tens of people by the end of June (Figure 8), when total deaths toll might reach somewhere between 18,000 to 42,000 (Figure 7).
Model predicts roughly 30,000 deaths, is it too pessimistic?
I know this is much higher than the PHE estimates of 20,000 total deaths. Here is why I believe the model prediction might still be optimistic.
The model assumes infection immediately stops upon lockdown, which works well in
China’s case. A main difference is China and Korea Republic took a more proactive approach to actively identify and quarantine anyone from the general public than western countries. In these two countries, geographical location of any new confirmed case is announced to the public via governmental websites and apps. But this is unthinkable in the UK due to privacy laws.
The relatively somewhat passive approach in the UK makes stopping the spread of virus immediately after lockdown more of a fairy tale. This may lead to longer recovery period.
What makes it worse is testing capacity has been limited in the UK so far (Figure 9). We will come back to this in the next section.


Figure 9.The predicted cumulative number of people under or after quarantine after developing symptoms (defined as Nq1 + Nq2 +Nr in the model, shown in black curve) plotted with the UK reported number of cumulative confirmed cases before 3 April 2020. Shaded area represents 90% confidence intervals of model prediction. UK data are plotted in connected dots.
The big question is, if you can’t identify carriers, how do you prevent the spread of the disease?
In addition, a big if is whether the effectiveness of lockdown in the UK would be the same as that of China. I wouldn’t want to get into the debate of the effectiveness of wearing face masks by the general public, but it may prevent, to some degree, the spread of virus by carriers.
What can the UK do? Test, test, test!
Among all the options above, testing seems to be the one that the UK may take.
When we compare the predicted cumulative number of people under or after quarantine after developing symptoms (defined as Nq1 + Nq2 +Nr in the model) with the reported cumulative confirmed cases, the contrast is stark. Model prediction is far higher than the reported confirmed cases (Figure 9).
To help protect lives, we simply need to perform more tests. This does not only protect doctors and nurses, but also key workers who are currently going to work every day, and all the rest of us who need to go out to buy food etc.
Conclusions
A sequence of connected events in a pandemic means it takes approximately 2 weeks for the daily death toll to peak after lockdown in China.
A tide of death increase might be coming in the next few days. With caveats, the model predicts it might take 3 weeks post lockdown for daily deaths to peak in the UK, as we went into lockdown later than China.
The model also predicts total death toll might reach 30,000, when daily deaths may come down to tens of people by the end of June.
Mass testing may help us shorten the period of pandemic
Unfortunately, a persistent lockdown goes against the economy. Nevertheless, it has to be a strong case before lives can return to normal in the UK. To generate the necessary compelling evidence No. 10 needs to make robust decisions in the near future, a group of scientists are joining forces to work out an exit strategy [4]. I only hope when we look back one day when this is all over, we would think the UK has made all the timely decisions on either tightening or lifting social distancing measures after going into lockdown on the memorable date of 23 March 2020.


NHS Nightingale Hospital at Manchester Central will accept COVID-19 patients in a few days. Photo taken by You Tao on 8 April 2020.
Reference
[1] All data used in this article come from EU Open Data Portal (https://data.europa.eu/euodp/en/home): https://www.ecdc.europa.eu/sites/default/files/documents/COVID-19-geographic-disbtribution-worldwide.xlsx
[2] Epidemic Calculator (http://gabgoh.github.io/COVID/index.html
[3] A short explanation to SEIR model on Wikipedia https://en.wikipedia.org/wiki/Compartmental_models_in_epidemiology#The_SEIR_model
[4] RAMP Initiative https://epcced.github.io/ramp/
Comments by Experts
“Dr. You's paper is interesting and very well written.” - Prof Lai Ying-Cheng, Arizona State University. Prof Lai publishes on asymptomatic carriers and China's exit strategy http://chaos1.la.asu.edu/~yclai/
"A pretty logical and measured piece and admits the limits of modelling." - Paul Agapow, PhD, Health Informatics Director at AstraZeneca https://www.linkedin.com/in/paul-agapow/
"Nice work - sensible analysis with credible results to answer critical questions!" - Chen Chao, PhD, Therapy Area Head, Clinical Pharmacology Modelling & Simulation at GSK https://www.linkedin.com/in/chao-chen-514bba4/
"That's great content!" - Paul Baverel, PhD, Head of Clinical Pharmacometrics Oncology at Roche https://www.linkedin.com/in/paul-baverel-phd/
"This was a wonderfully thoughtful review and provided a different perspective on the outbreak that I had previously considered." - Peter Warn, PhD, Magic Bullet Consulting https://www.linkedin.com/in/peter-warn-4368b625/


Comments